
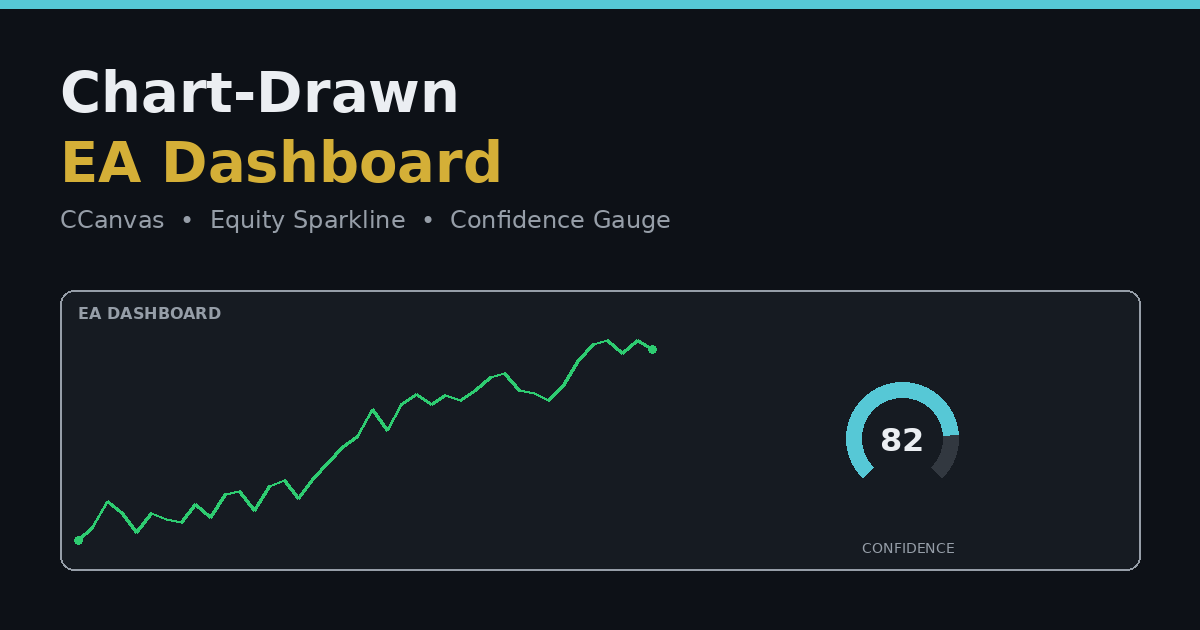
Most MT5 EAs run invisibly — a trader has to check the terminal's trade history or export a report to see how the strategy is actually performing. A modular self-learning EA takes a different approach: it draws its own live dashboard directly on the chart, using MT5's native canvas drawing API rather than any external charting tool, so a trader can glance at the confidence score and equity trend without leaving the chart window.
Why Draw on the Chart Instead of Using a Separate Window
MT5 doesn't give an EA a native way to build a rich, custom UI the way a desktop application framework would. The workaround this EA uses is MT5's CCanvas class, which lets an EA draw arbitrary pixel graphics directly onto a chart object. That means the entire dashboard — panels, gauges, sparklines — lives as an overlay on the same chart the EA is trading on, with no separate window to manage, resize, or lose track of.
Two Custom Pixel-Graphic Widgets
Two specific widgets are built this way rather than using MT5's built-in chart objects:
- Equity curve sparkline: a small, continuously updating line graphic tracking account equity over time, rendered pixel-by-pixel rather than as a series of chart objects. This gives a compact, at-a-glance trend view without needing to open a separate equity report.
- Confidence gauge: a visual representation of the current 0-100 confidence score the scoring engine just calculated for the most recent signal — turning an abstract number buried in a log into something readable in half a second.
Building both as custom canvas graphics instead of native chart objects (like trend lines or text labels) gives full control over exact appearance — colors, curve shape, gauge arc — independent of the trader's chart theme or template settings.
Dashboard, History, and Drawing as Separate Modules
The UI layer itself is split into distinct responsibilities rather than one large rendering function: a DashboardPanel handles the live summary view, a HistoryPanel handles past-trade review, and a separate DrawingManager is responsible specifically for chart annotations — order blocks, fair value gaps, and structure markers (BOS/CHoCH levels) drawn directly onto the price chart so a trader can visually verify what the SMC analysis engine detected, rather than trusting the confidence score blindly.
Auto-Rescaling Layout (ReflowLayout)
A dashboard hard-coded to specific pixel coordinates breaks the moment a trader resizes the chart window or switches to a different monitor resolution. The panel and canvas widgets handle this with a reflow layout function that recalculates positions and sizes based on the current chart's pixel width and height whenever the chart is resized — so the dashboard stays legible and correctly proportioned across different window sizes and screen setups, including running the same EA across the multiple PCs it's deployed on.
Why Visual Verification Matters for an SMC-Based EA
An EA whose entries depend on order blocks, fair value gaps, and structure breaks is making judgment calls that are easy to get subtly wrong in code — a swing high detected one bar too early, an order block zone drawn slightly off. Having the DrawingManager render exactly what the StructureAnalyzer and SMCAnalyzer modules detected, directly on the live chart, turns debugging from "read the code and hope" into "look at the chart and compare." This is especially valuable during the initial data-collection phase, when trust in the scoring engine's SMC detection hasn't yet been established through enough live trade history.
A Practical Lesson for Anyone Building EA Dashboards
Splitting dashboard rendering, historical review, and chart annotation into separate modules — rather than one monolithic "draw everything" function — makes each piece independently testable, and means a bug in the equity sparkline doesn't risk breaking the order-block drawings. Combined with resize-aware layout logic, this is what makes a chart-drawn dashboard viable as a permanent fixture rather than something that only looks right at the exact window size it was built and tested on.
Related Reading
- SuperTrend Martingale EA for XAUUSD: Phase A/B Self-Learning Engine Explained (MT5)
- Inside a Self-Learning MT5 EA's 8-Factor SMC Confidence Score (and a Learning Engine Bug)
- Grading Structure Breaks in an MT5 SMC EA: The V1.49 Structure Scoring Redesign
- Percentage-Risk Sizing and Correlation Filtering in an MT5 EA (No Martingale, No Grid)


.png)
0 Comments